For my Data Visualization class I made a poster to visualize the trends shown by public testing and positive case data for several countries at the beginning of the COVID-19 pandemic (until May 13, 2020).
At this stage, there were many unknowns as to what good public policy entailed when dealing with the COVID-19 pandemic. In order to distill a preliminary "evaluation" for the performance of each country hit by the pandemic, I proposed the curve formed by the ratio of tests performed over confirmed COVID-19 cases.
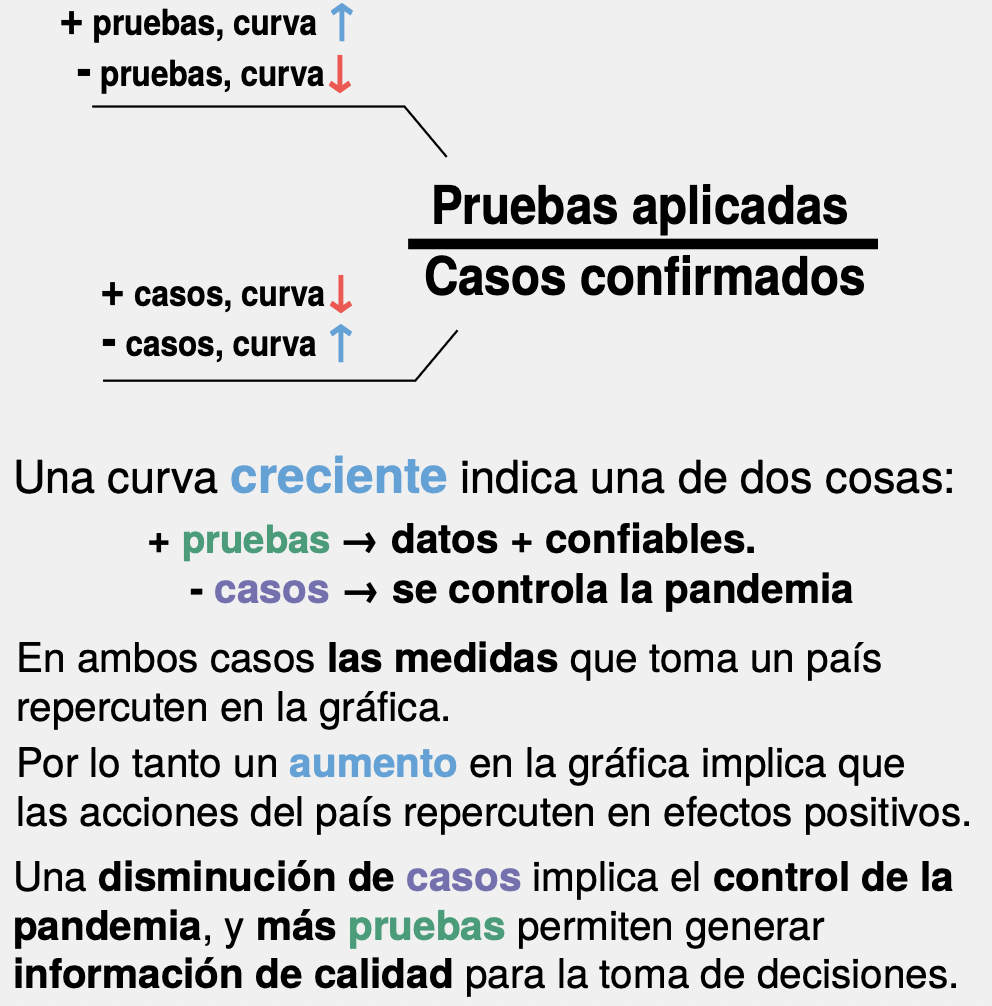
Explanation of the movements in the curve.
When the curve grows, it is either due to more tests being performed (indicating more reliable data) or less cases detected (indicating that less people are being infected). On the other hand, when the curve decreases, it means that the country will have a harder time dealing with the pandemic, either due to having less information to analyze, or because cases are rising.
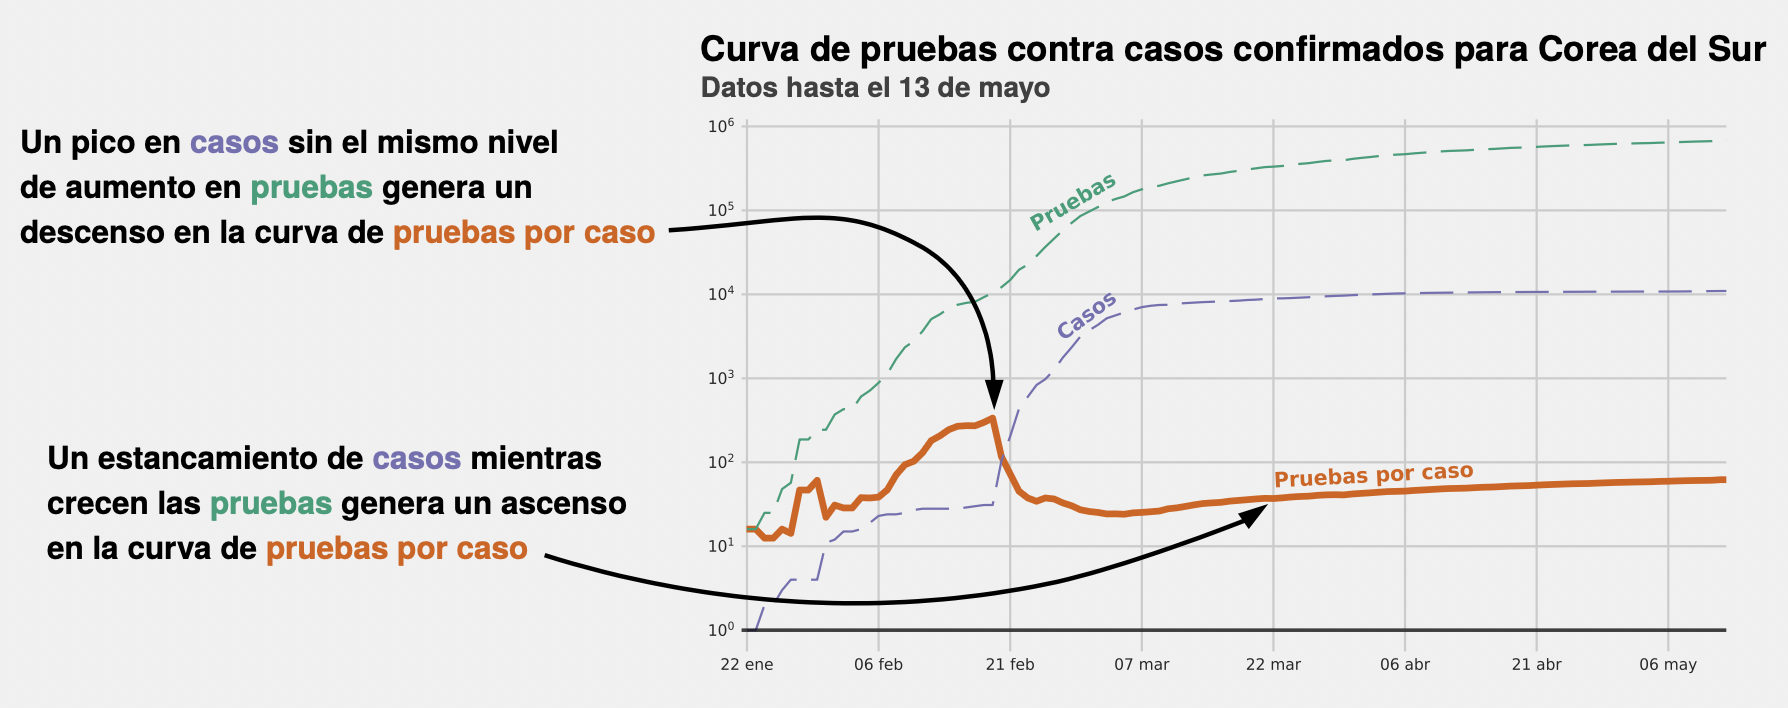
Example for South Korea's curve.
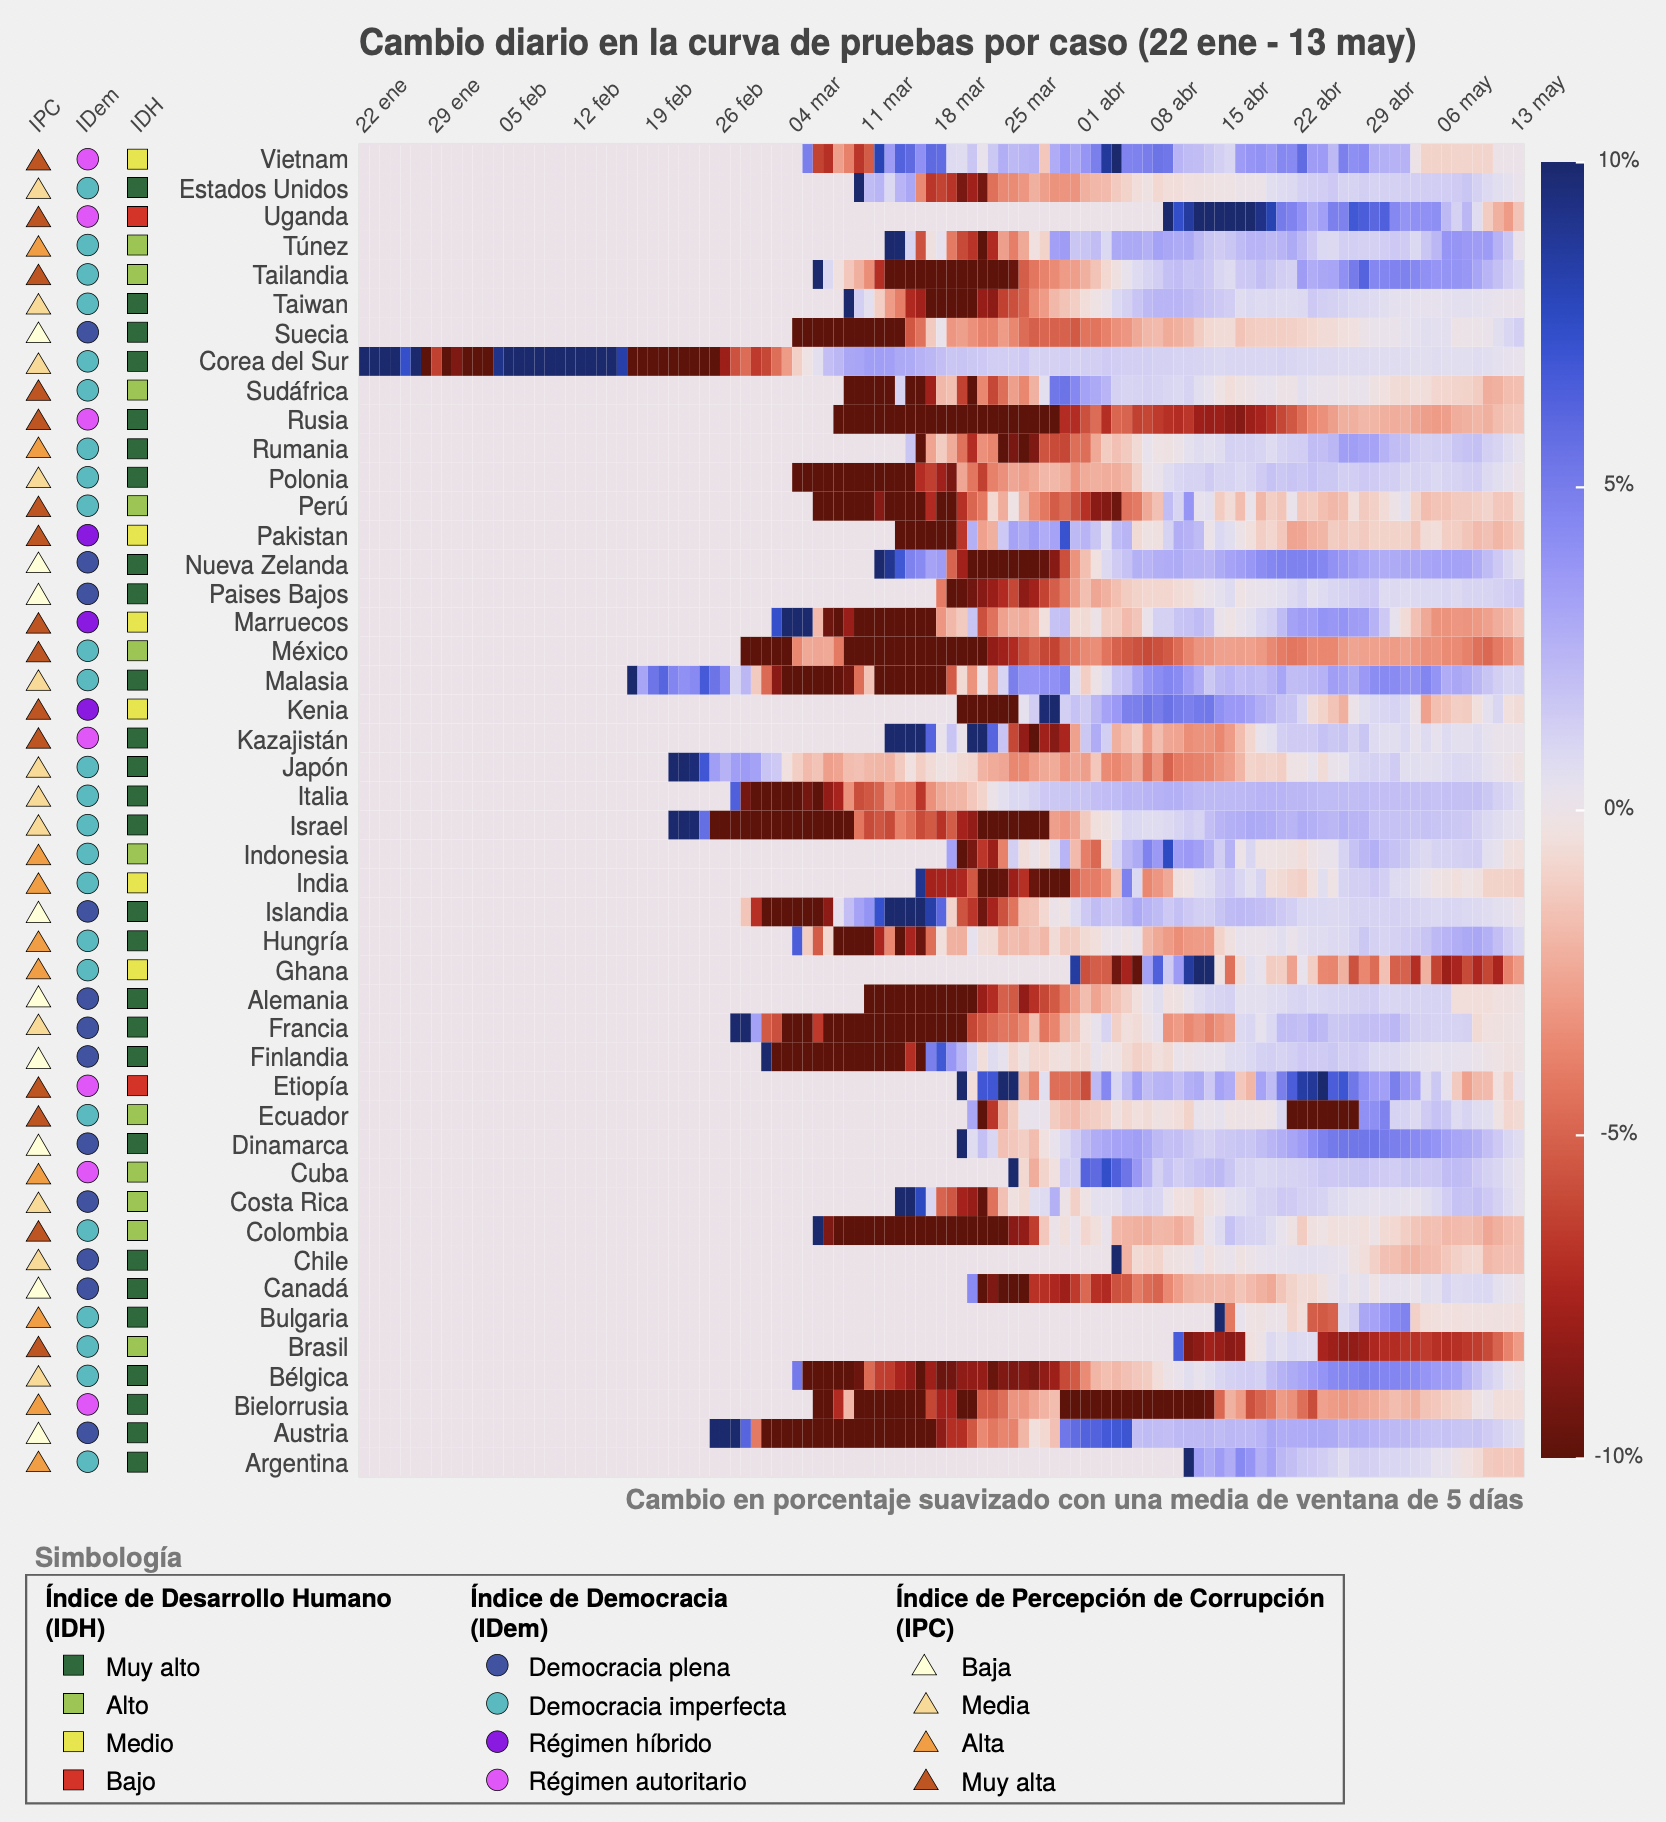
Comparison between countries and territories with accessible public data.
Some of the observations made in the document were:
- It is normal that any given country will have a steep decrease in its curve at first.
- In general, a country with a lower corruption perception will manage to increase its curve by the first 2 weeks.
- Authoritarian countries don't seem to fare better than others in general.
- Asia-Pacific countries had a tendency to grow their curves, while Latin American countries (except Cuba) didn't.
- For the period observed, the best performing countries included Vietnam, Thailand, South Korea, New Zealand, Malaysia, Italy, Denmark and Austria, while the worst performing were Russia, Belarus, Mexico and Ghana.